Many years ago when I was just in secondary school, I picked up a certain book called Learn Python 3 The Hard Way by Zed A. Shaw. This wouldn’t be the first time I’d pick up this book - I tried to work through but at the time, I just didn’t have the self-discipline to learn a new skill by myself. I also tried working through it again when I was studying for my Chemistry undergrad degree, but after being swamped with assessments, coursework and exams, I never found the time to work through it. It wasn’t until about a year ago while I was unemployed after leaving my job as a brewer at Tiny Rebel that I picked it up for the third time and actually worked through it. I still don’t know why it was different this time, but I was absolutely captivated by the simplicity of Python and how such a tool could be used to have control over computer programs. Even simple exercises involving manipulating strings or adding numbers in a loop made my neurons fire off with excitement for all the things I could use this programming language for.
After working my way through the book, I wrote my first program - weather-cli. This was a simple command line tool where you entered the name of a city and would receive a detailed report about the weather in that area. It used a geocaching API and the Met Office’s Weather DataHub API, and all the program did was take the name of the city, pass it to the geocaching API to get its latitude & longitude coordinates, then feed that into the Met Office’s API to receive the data. It wasn’t much, but I was satisfied with the state of this project and then moved on to others.
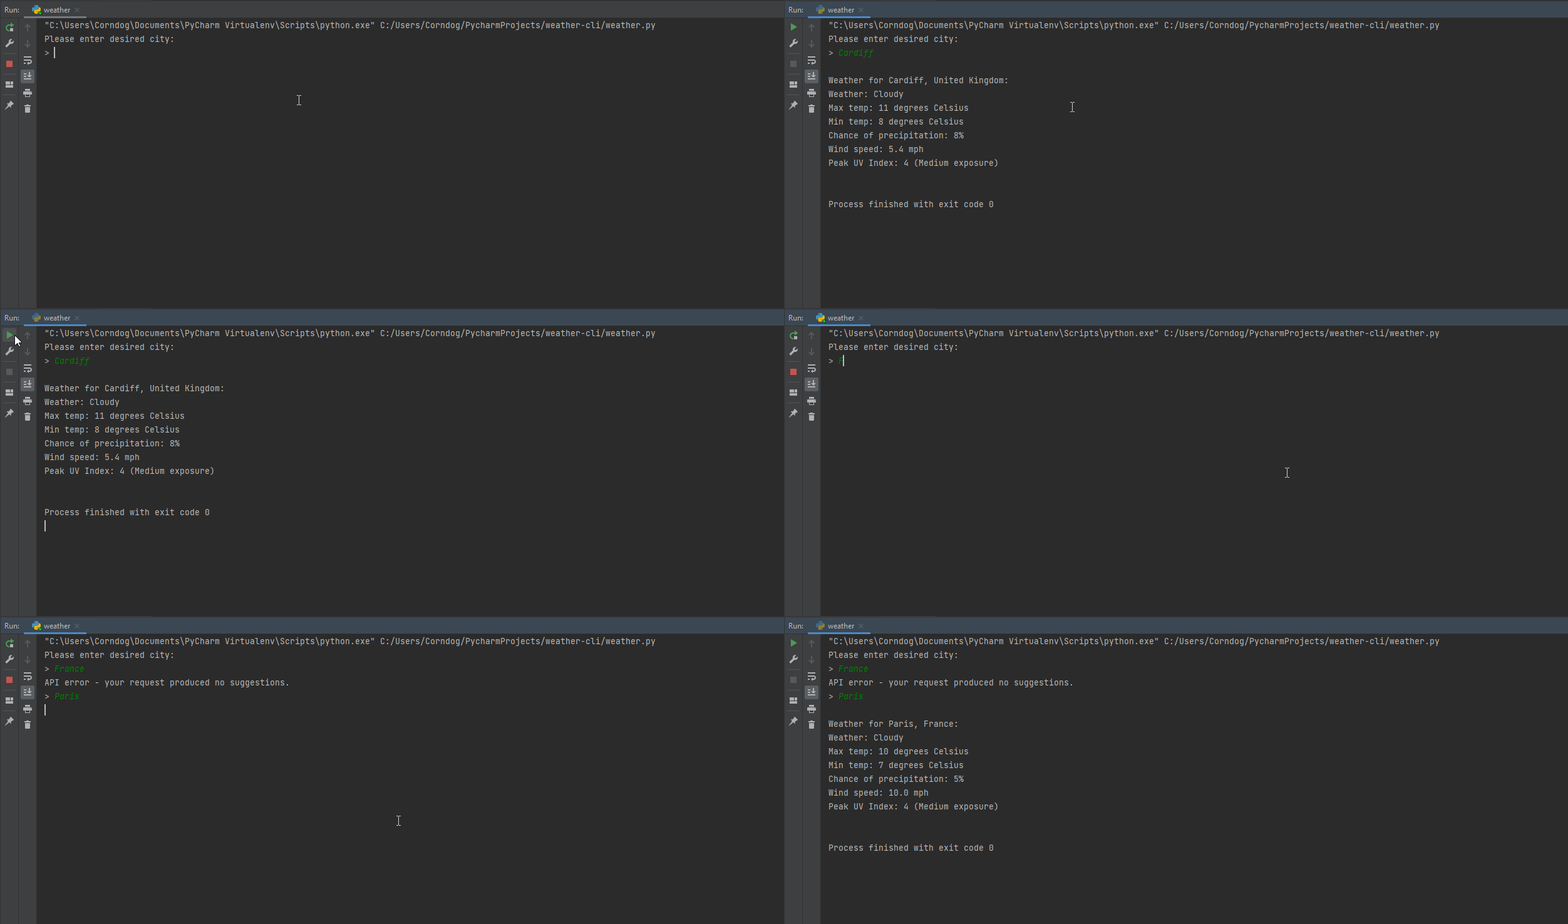 weather-cli in action
A few months later, I had the opportunity to work for Urban Foundry, who ran the Arts ARKADE project in the Swansea city centre. This was launched as the first stage of an eventual creative hub for artists across Wales, and it inspired me with the idea of using my newly-found programming skills to produce some kind of artwork. I turned back to weather-cli and remembered just how much data the Met Office API actually returned to me - temperature highs and lows, wind speed & direction, humidity, even things I’d never heard of like the probability of sferics! My intention was to create a program that generated patterns that had been styled and coloured based off certain values received from the API request.
I chose to use the Hilbert curve for my patterns, as it is a fairly simple space-filling curve with plenty of properties that I could tweak to create a variety of different patterns. Using Numpy and Matplotlib, as well as the hilbertcurve library for generating the coordinates, I set out trying to make my first pattern. With some playing around with the libraries and a small measure of Stack Overflow. I finally got my program to do something.
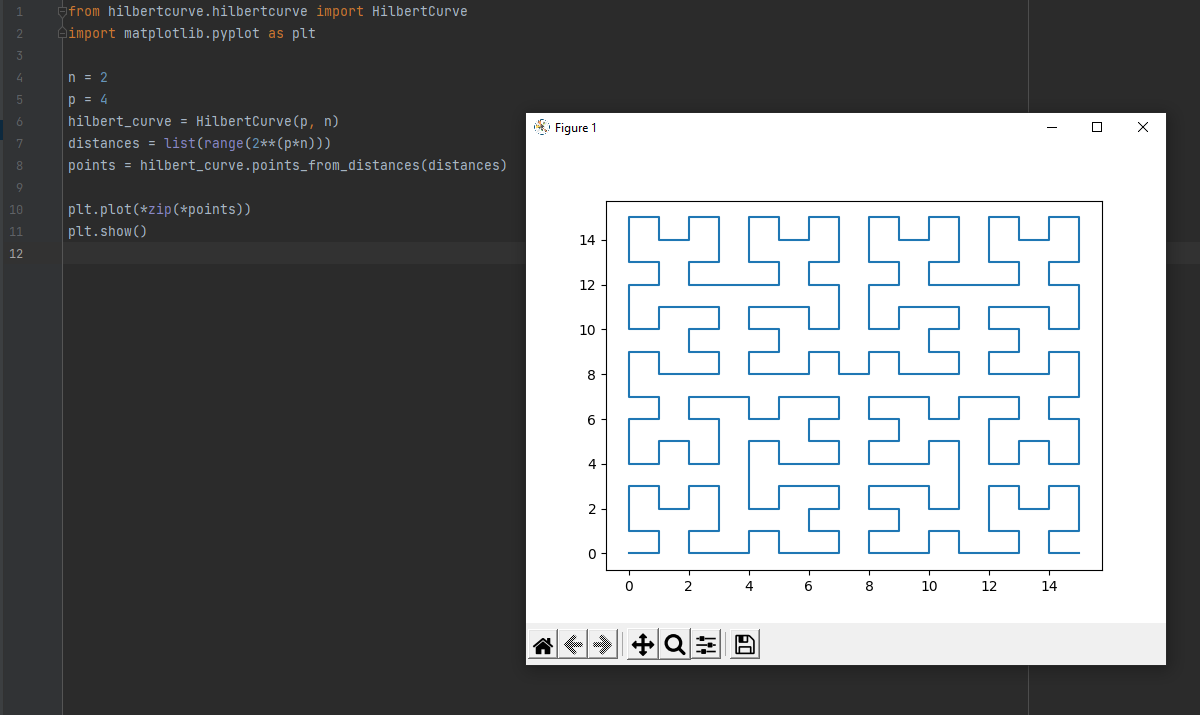 It’s not pretty, but everything has to start somewhere…
The next step was to make it less ugly. I researched how to remove the default Matplotlib axis labels, force it to use a 1:1 aspect ratio and change the colour of the background. This is when I had the idea of using a range of colours of the rainbow to reflect the lowest and highest temperature of the day in the pattern. Adding a colour gradient to the curve was a bit of a challenge at first, as every individual segment had to be coloured, and the length of the list would have to be different if the pattern was more intricate. Fortunately, I found the colour.py library which allowed me to easily generate a range of colours between two values with the exact required length to map each value to a segment of the curve.
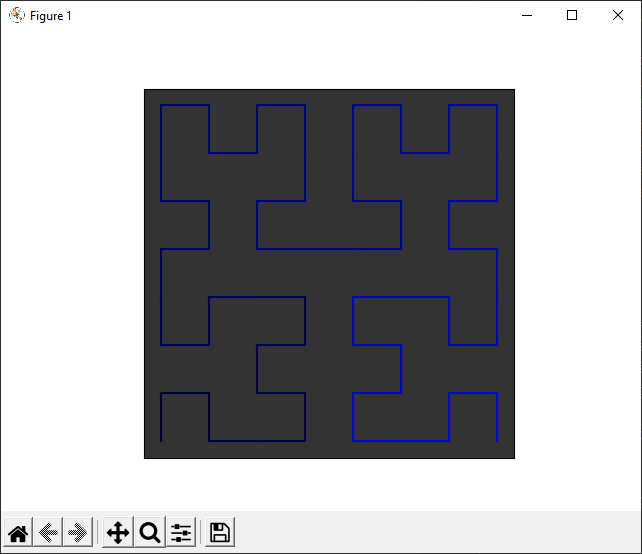 Getting better…
It was starting to look good, but I felt it needed more in order to represent the weather data better. I decided to give it a gradient background, which starts from the cardinal direction reported by the weather data. I also chose to represent the type of weather for the day (clear skies, rain, clouds, etc) as the colour of the gradient, even choosing some unusual combinations for rare weather events such as lightning or snow which I though would an interesting side to the patterns over a long period of time. The rarity of the unusual weather would be reflected with how infrequently the colour is used for the background.
Once the code for generating the patterns was in place, it was finally time to reuse my code from weather-cli to retrieve the weather report and use its data to alter the patterns.
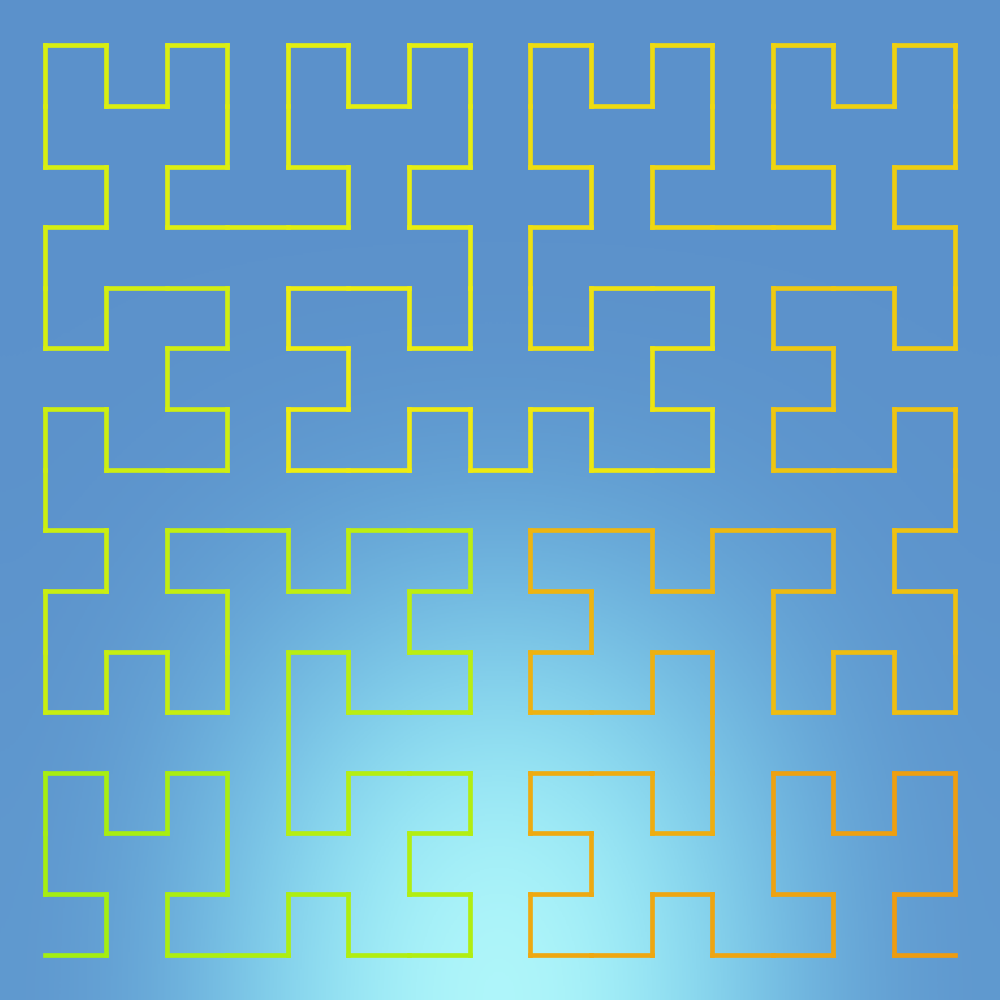 A pattern generated on a particularly warm and sunny day in June 2022
At this point, it was awesome seeing how far this project had come from just a simple command-line tool. I proceeded to run it manually on an almost-weekly basis between July and December, and could start to see a clear distinction between the patterns created in the summer compared to the patterns generated in the winter.
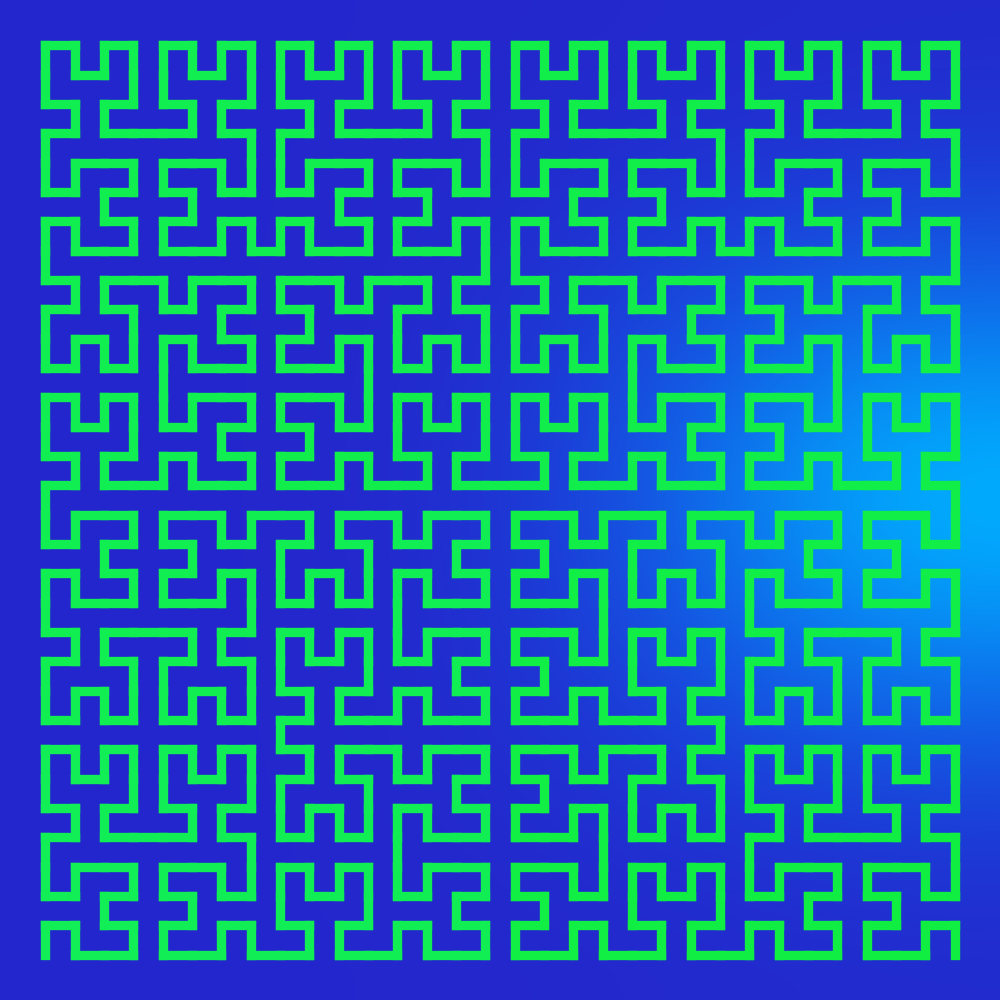 A pattern generated on a very rainy and cold day in December 2022
With the patterns I created, I was given the opportunity to display the project in a retail unit in the Swansea city centre!
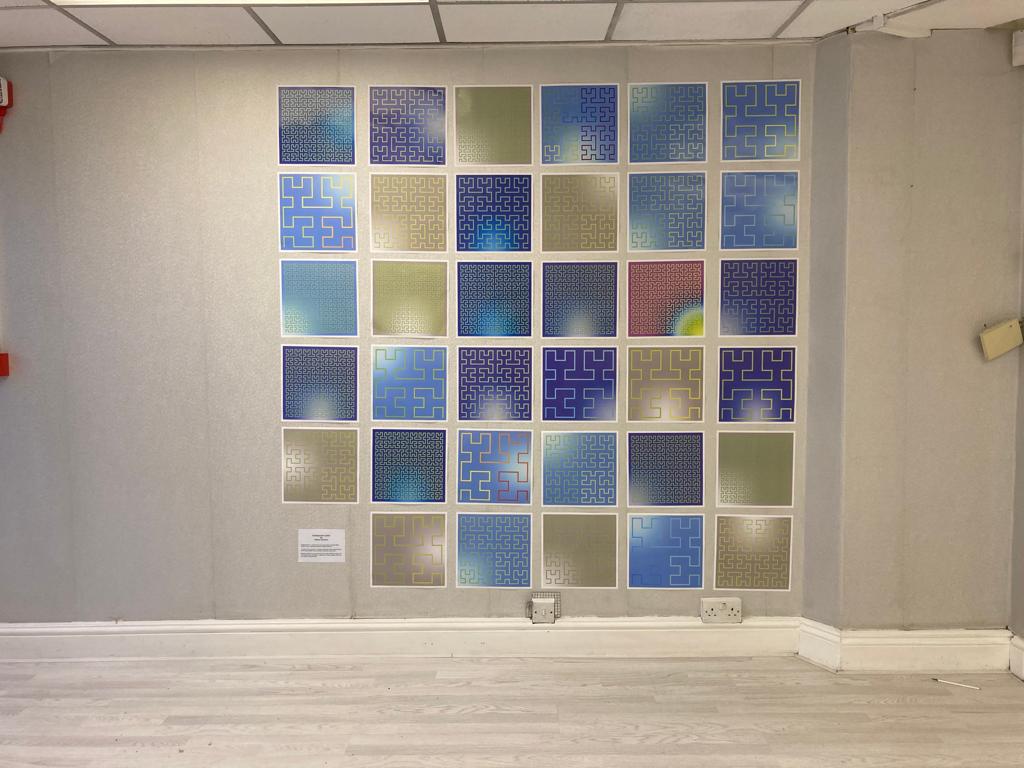
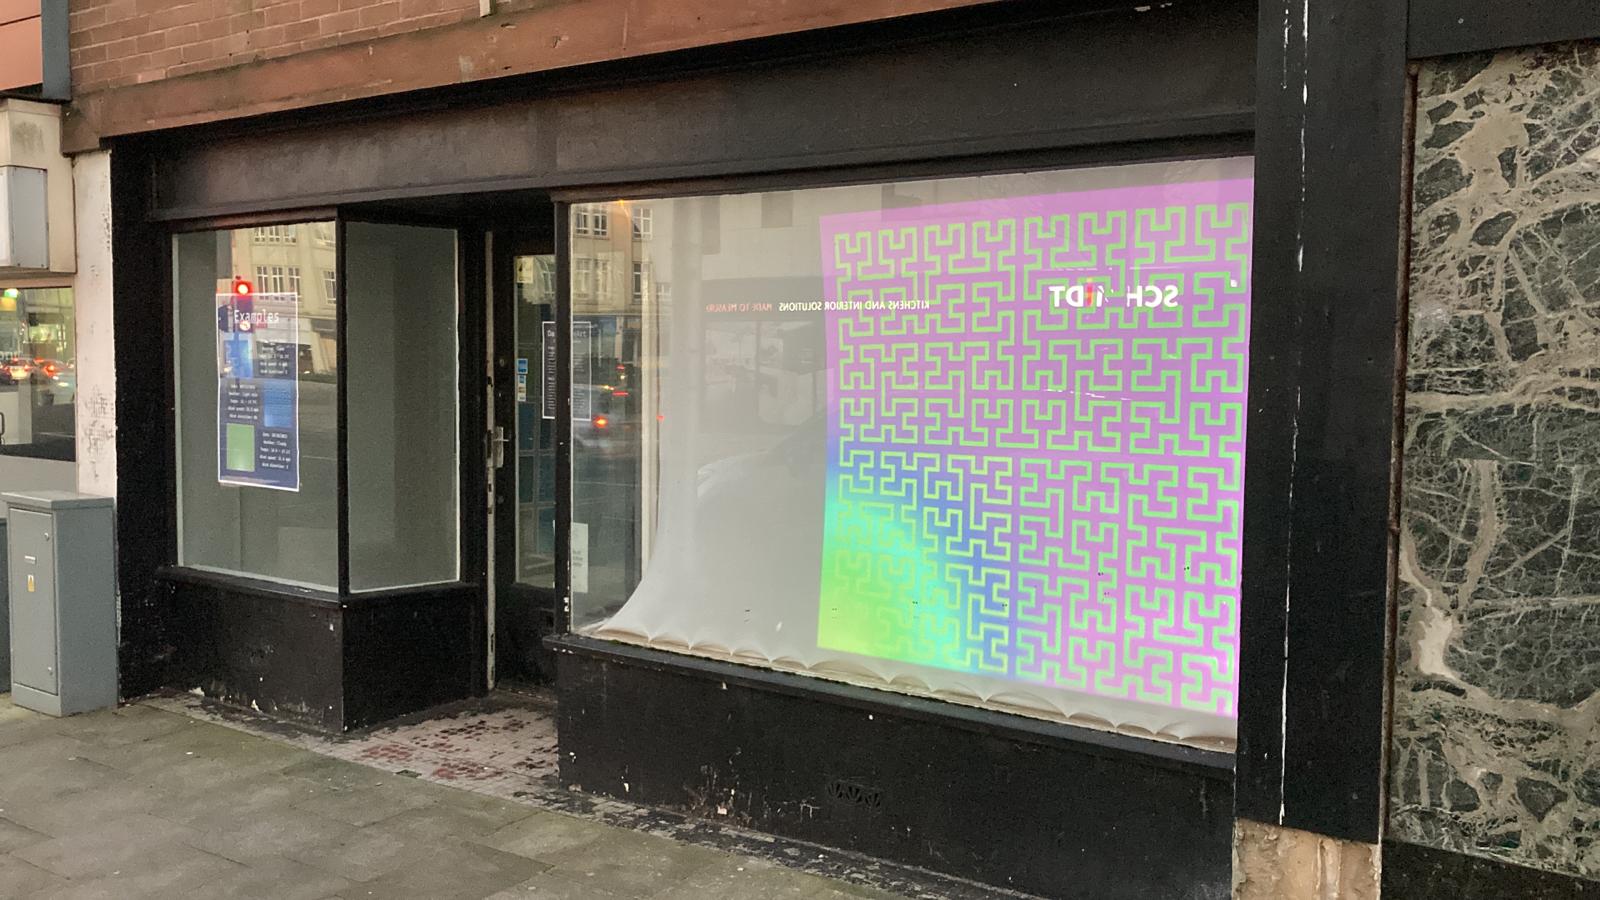 The exhibition lasted for a few weeks and could be found on Bellevue Way, just around the corner from The Dragon hotel.
So what else can I say about my experience with this project? I would just like to put forward the notion that if you want to create something interesting (whether it’s software or not), it’s perfectly fine to go off a completely rough idea and see where it ends up. Play around more, experiment and make mistakes - the journey holds as much value as the result, and you might even make something interesting at the end of it!